
Reference
Signal Activity mapped to MITRE ATT&CK framework
How the Signals tab displays techniques associated with workbooks that have triggered signals.
Updated 2026-08-17
Signal Activity mapped to MITRE ATT&CK framework
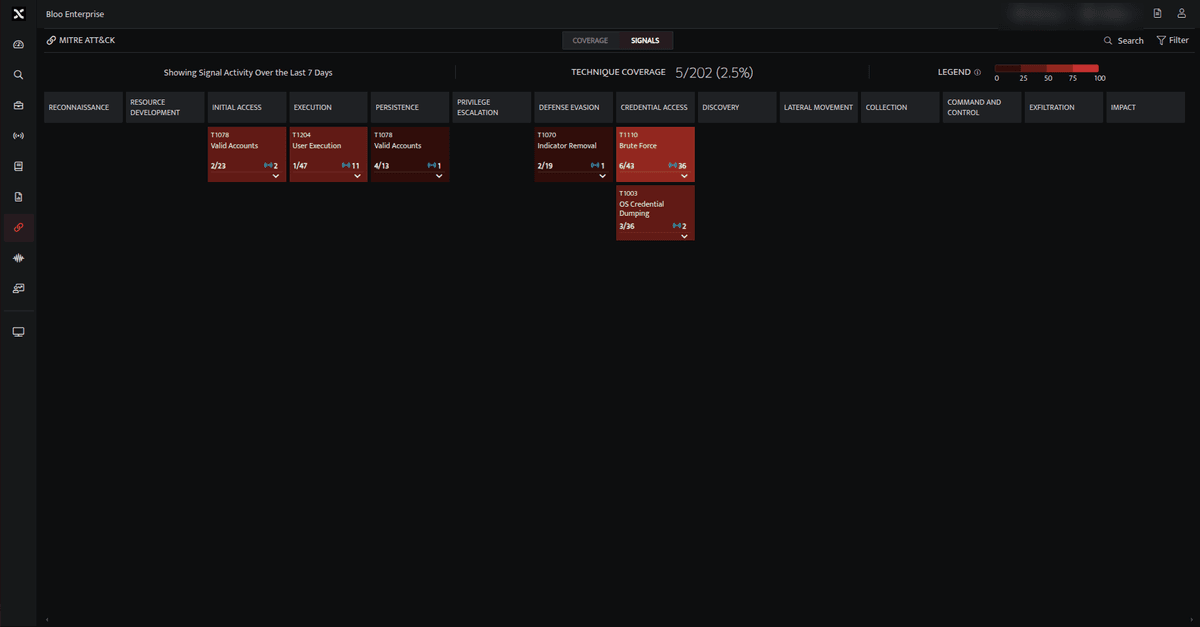
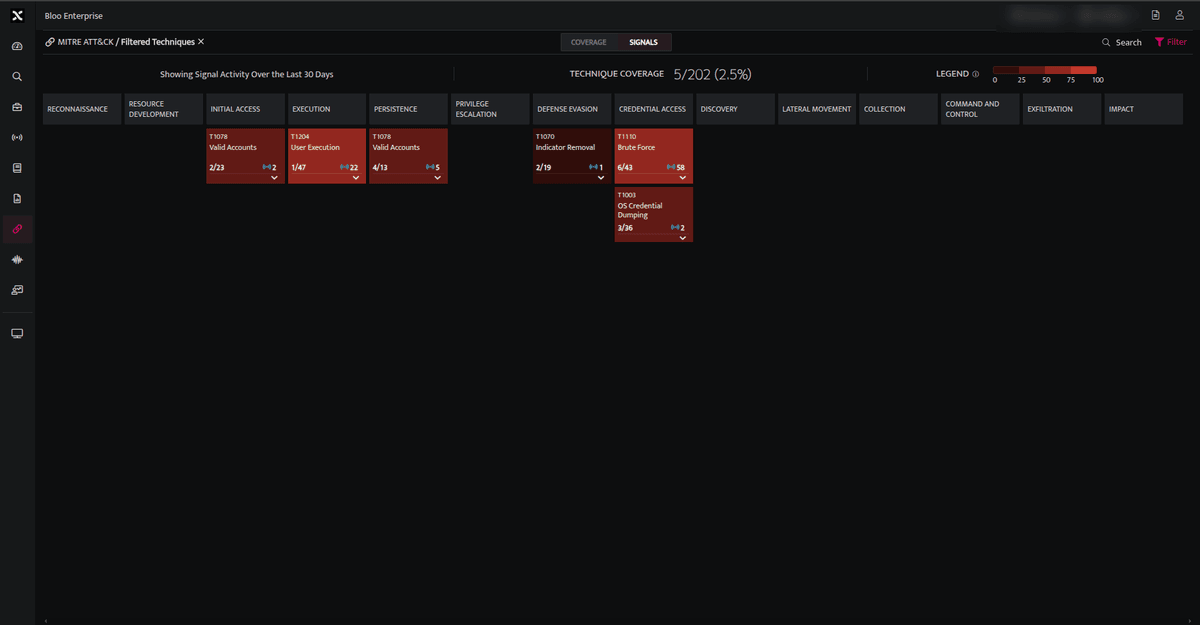
The Signals tab displays techniques associated with workbooks that have triggered signals.
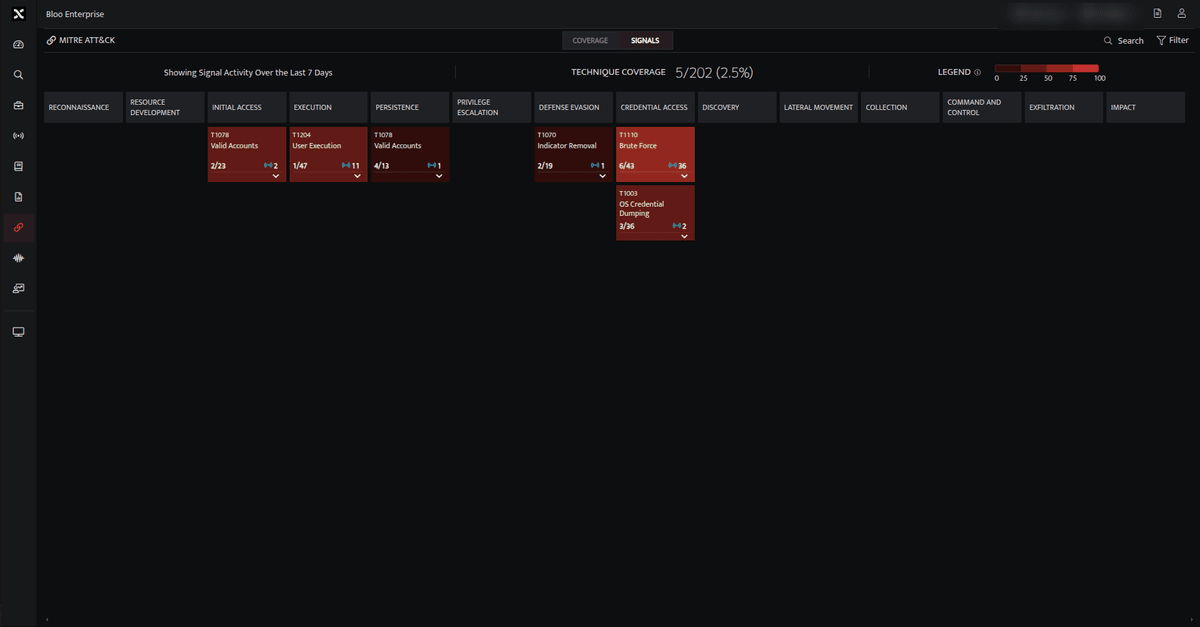
Components of Signal Tab
| Fields | Description |
|---|---|
| Signal Count | Total number of signals generated from workbooks associated with a particular technique (in the last 7 days by default). |
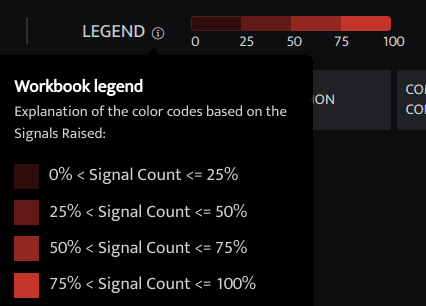
| Legend | The color coding represents the ratio of the total signal count for each technique to the sum of all signal counts, displayed as a percentage across the selected duration. |

Filtering over Signal Activity:
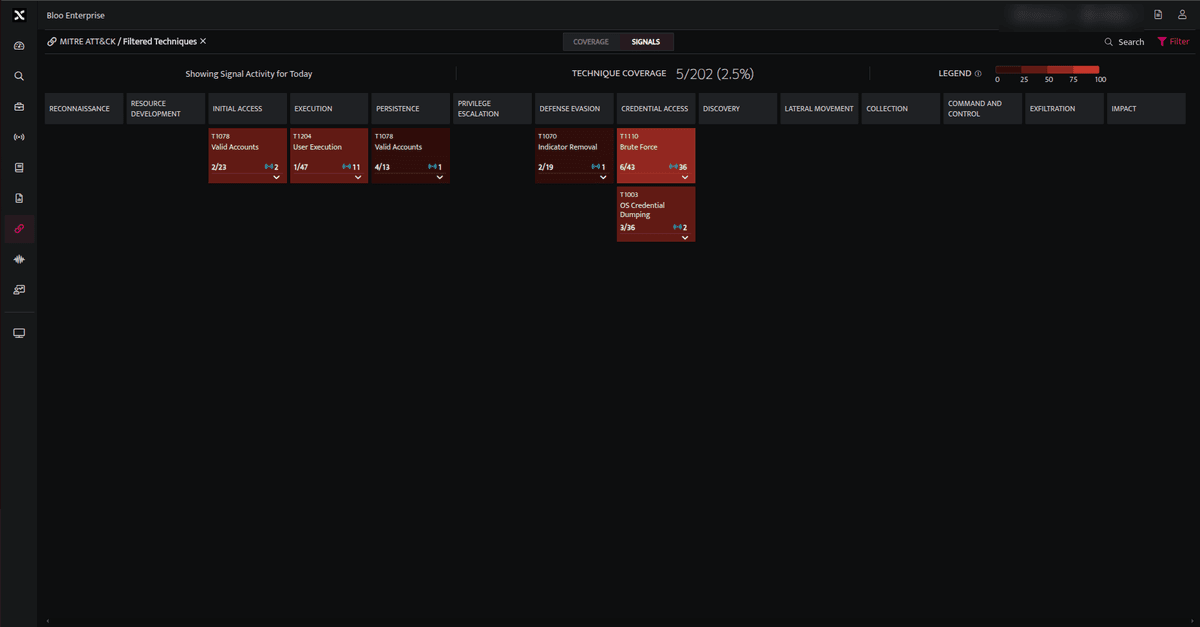
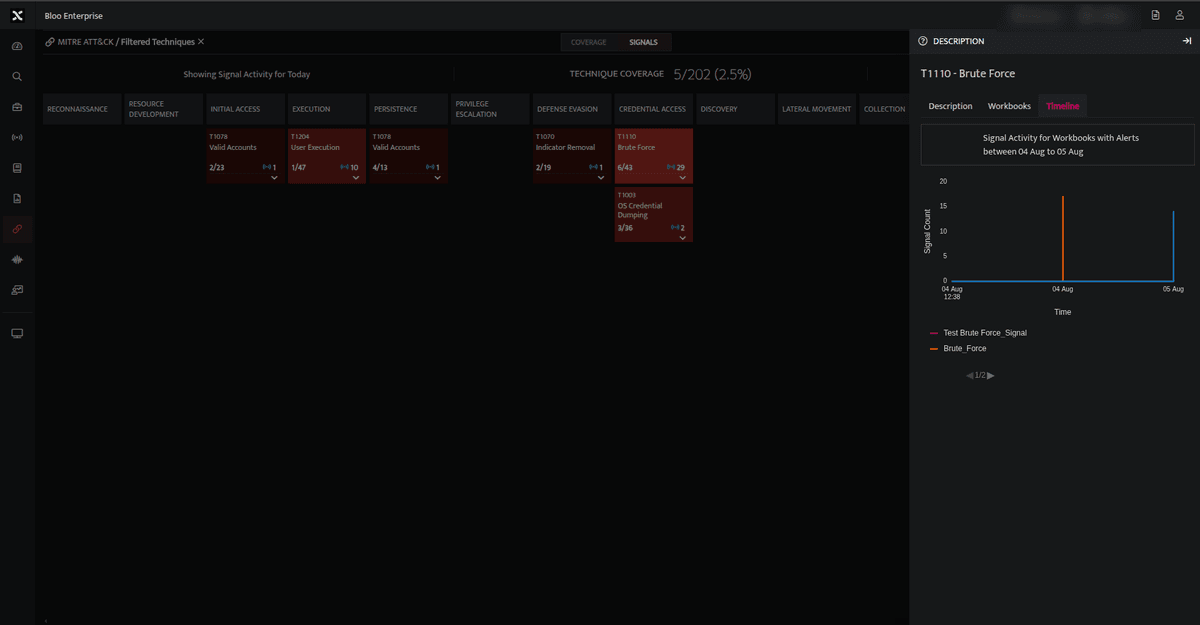
- 1 Day: Shows signal activity for the current day.
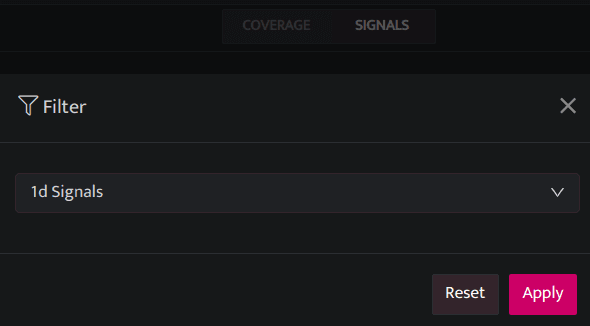
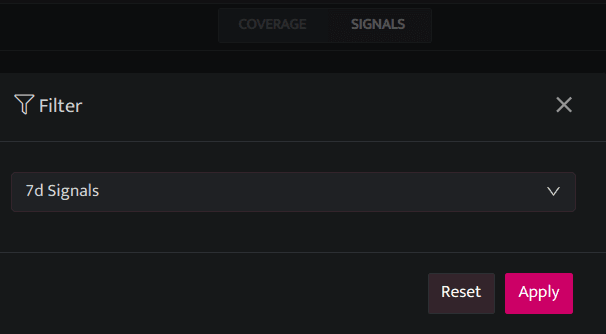
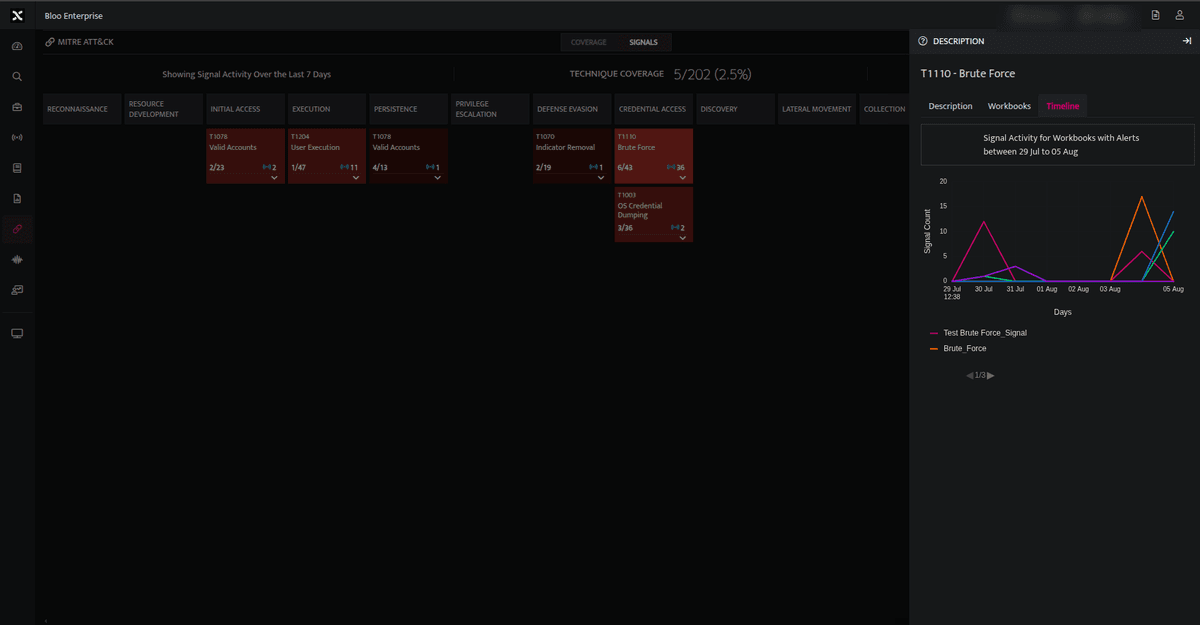
- 7 Day: Shows Signal Activity over the last 7 days. (default time filter)
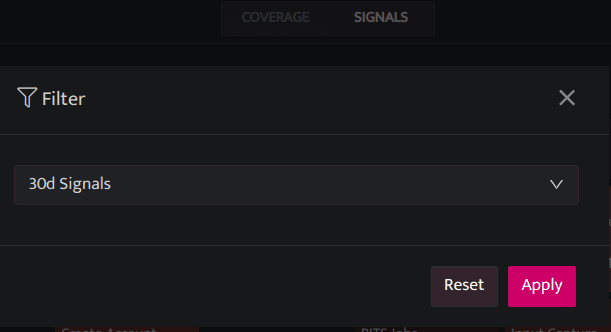
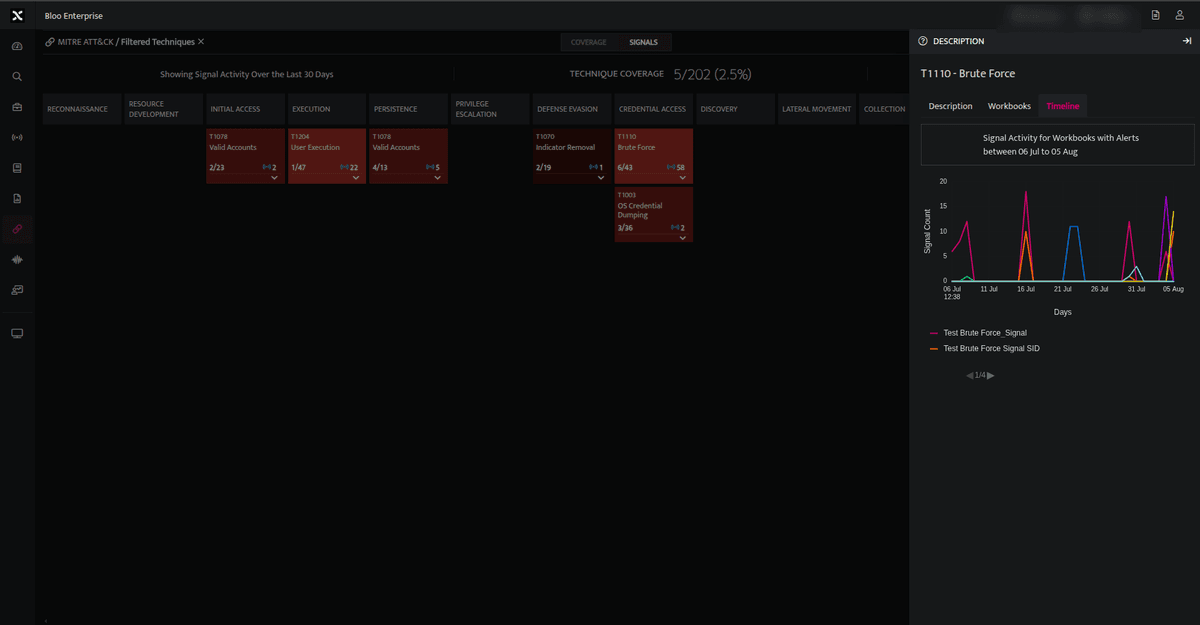
- 30 Day: Shows Signal Activity over the last 30 days.
Visualizing the Signal Activity by Timeline
Displays a line chart of signal activity over the selected duration (default: 7 days). Users can view signal counts for specific days or times. By clicking on a workbook name in the list, its data line is highlighted, allowing users to investigate signal activity for the selected workbook. (Note: To deselect a workbook, double-click its name.)
- Showing signal activity for the current day.
- Showing Signal Activity over the last 7 days.
- Showing Signal Activity over the last 30 days.
Related
Was this page helpful?