
Reference
Bipartite Chord
How to create a bipartite chord diagram in a Bloo workbook.
Updated 2026-08-17
Bipartite Chord
This chart displays the flows or connections between different entities, each entity represents a part of the circular layout. You can hover a specific entity to highlight all its connections. You will have to group your data to form the chord.
Creating a bipartite chord diagram
- Go to workbooks, add a DQL block and enter a query. Ensure the query includes a stream and the results are grouped as per requirement.
For Example:
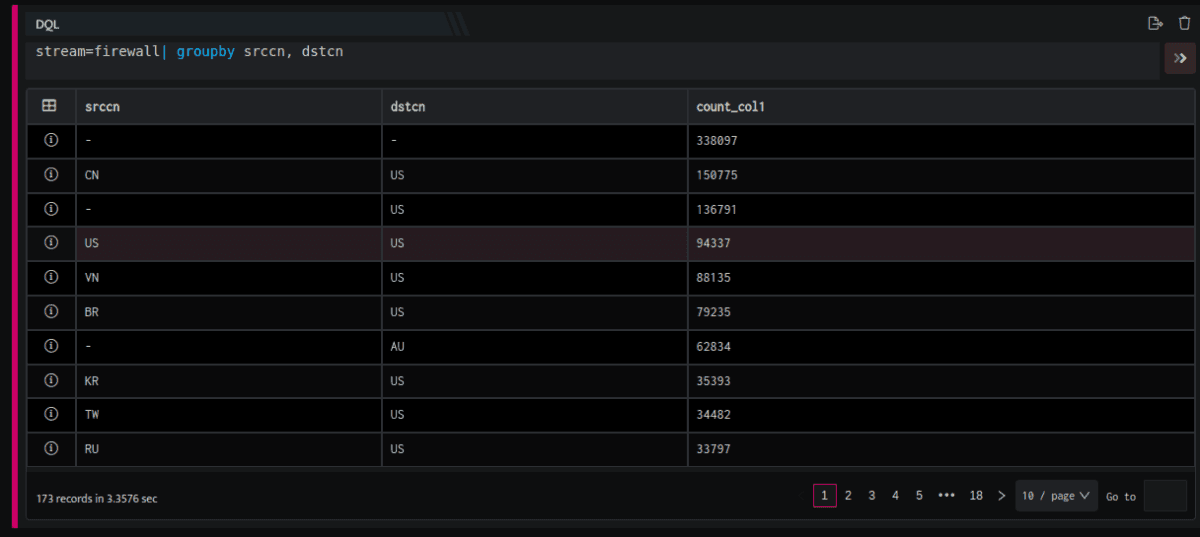
stream=firewall| groupby srccn, dstcn- This query retrieves all fields for each event where
stream=firewalland the output is grouped bysrccnanddstcn. The final output is sorted in the descending order ofcount_unique(by default). The query results will be displayed as follows.
- Now add a visual block, and enter the following details in the field provided.

| Field | Description |
|---|---|
| Name | Enter a name for this particular chart that you are creating |
| Type | Select Bipartite Chord from the drop-down |
| Primary | Select the primary value for the chart to be created |
| Secondary | Selected the secondary value for the chart to be created. Note: You can add multiple secondary values as per requirement. |
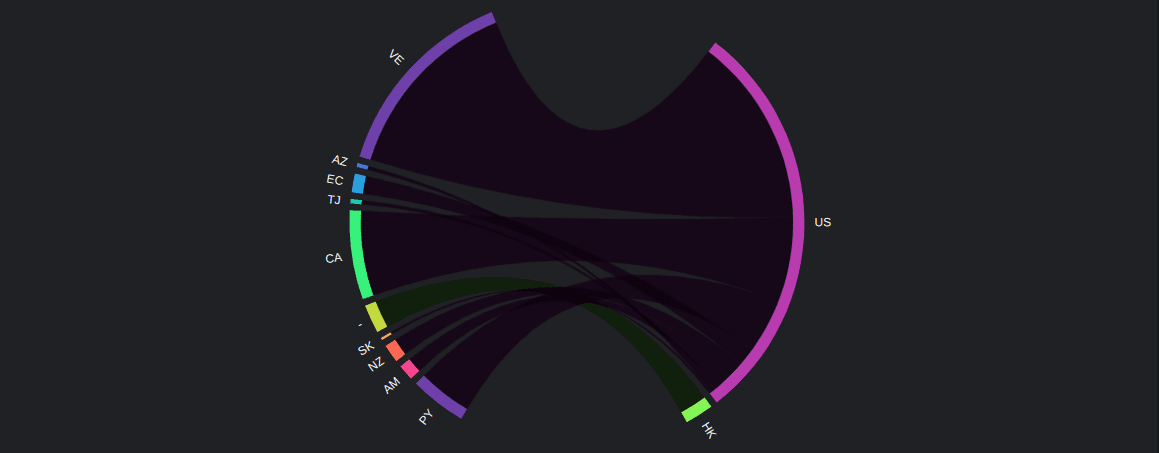
- Hover on the country code to view the exact count.
Related
Was this page helpful?