
The Core Concept: Radar to Response
The Micro-Doppler Effect refers to frequency modulations around the main Doppler shift caused by small periodic movements (e.g., a rotating helicopter blade). In physics, these modulations reveal a target’s unique characteristic signature.
From Counter-UAV Defense to Cyber Defense
My inspiration comes directly from Defense Radar Signature Analysis. In a high-stakes, sub-10-second window, defense systems must answer a critical question: Is this a $1000$ consumer drone, a multi-million-dollar surveillance UAV, or a harmless vulture? The decision on countermeasure (e.g., a jammer vs. a missile) depends entirely on signal differentiation – distinguishing a propeller’s rhythmic signature from the erratic, natural motion of a bird’s wing.
In cybersecurity, this high-stakes decision maps to the C2 beaconing problem. Attackers intentionally use consistent time intervals (5-minute, 10-minute) for check-ins, knowing these low-volume, high-frequency patterns are invisible to simple threshold rules.
Our methodology treats the stream of Sysmon events (like DNS queries) as a time-series signal. We use the mathematical tools of radar, specifically the Fast Fourier Transform (FFT), to transform the time-domain data into the frequency domain. This transformation instantly reveals any hidden, periodic signature that indicates a stealthy, rhythmic attack.
The Problem: Why Traditional Detection Fails
Periodic attack patterns evade traditional security operations because they are too low-volume to trip a count-based threshold.
Scenario: A C2 beaconing every 5 minutes (288 events/day).
- Traditional Rule: “Alert if > 10 DNS queries in 1 minute.”
- Result: The beacon sends only 1 query per 5 minutes. The rule is MISSED.
This failure to detect periodic patterns is why the SOC is trapped in the CHAOS ZONE – paralyzed by noise while critical, rhythmic threats pass silently through.
Granular Explanation & Mathematical Model
The power of Micro-Doppler lies in its mathematical foundation:
Physical Foundation
The fundamental Micro-Doppler Modulation is expressed as:
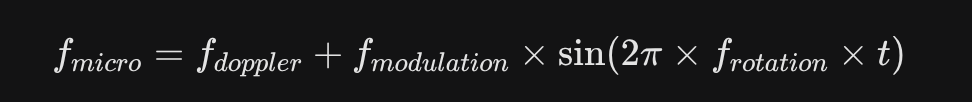
In cybersecurity, the signal is the event count per minute, and the rotation is the attack’s beaconing frequency (e.g., once every 5 minutes).
Frequency-Domain Representation
By applying the FFT to the event time series, we translate the complex time sequence into a simple frequency spectrum, where periodic behavior appears as a clear power peak.
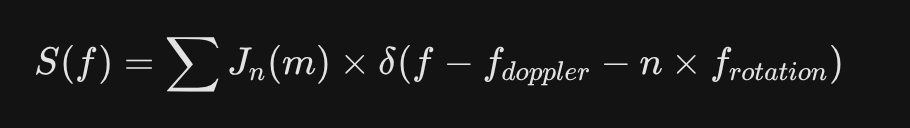
- f_{rotation} becomes the easily identifiable beaconing frequency.
- The power of the peak (amplitude) measures the statistical confidence in the pattern.
The Innovation: Multi-Dimensional Micro-Doppler Architecture
The single-dimensional approach (just checking event counts) is prone to false positives. The true innovation is a Multi-Dimensional Micro-Doppler architecture that filters patterns by their contextual identity.
Multi-Dimensional Filtering for Precision
We calculate the Periodic Signature against a known, learned baseline across multiple dimensions simultaneously:
Periodic_Signature[system, user, process, domain, time] = FFT(Time_Series[system, user, process, domain, time]) DimensionWhy It MattersAdaptive BaselineSystem TypeWorkstation patterns (user-driven) differ from Server patterns (service-driven).Adjusts expected frequency ranges (e.g., less suspicious of 60-min server heartbeat).User ContextService Accounts have extremely stable patterns; Admin Accounts are highly variable.Sets strict thresholds for stable accounts; lenient thresholds for variable accounts.Process Contextsvchost.exe has normal periodicities; powershell.exe typically has none.Any periodicity in powershell.exe becomes highly suspicious.Time of DayLow baseline during Off-Hours means any periodicity is extremely suspicious.Multiplies the power threshold during business hours (less sensitive) and reduces it during off-hours (more sensitive).Example: Per-Process Context
The core idea is to profile expected periodic signatures for every unique process.
Python
def get_process_periodic_signature(process_name, parent_process):
# Learn normal periodic patterns for each process
process_profiles = {
‘explorer.exe’: { ‘normal_periods’: [60, 120], ‘variance’: ‘high’, ‘power_threshold’: 0.3 },
‘svchost.exe’: { ‘normal_periods’: [15, 30, 60], ‘variance’: ‘low’, ‘power_threshold’: 0.25 },
‘powershell.exe’: { # Any periodicity is suspicious
‘normal_periods’: [],
‘suspicious_periods’: [5, 10, 15],
‘power_threshold’: 0.2 # Very sensitive
}
}
# Logic to adjust threshold based on parent process (e.g., being stricter for process spawns from PowerShell)
return process_profiles.get(process_name, default_profile)
Calculations & Examples
The final detection logic combines all dimensional thresholds to compute a total, context-aware Power Threshold.
Example Detection: Stealthy C2 Beaconing
ContextDetailConfig ValueSystemWorkstationBase $P_{thr}$: 0.25Processpowershell.exeProcess $P_{thr}$: 0.20DomainNew-Unknown-DomainDomain $P_{thr}$: 0.15TimeWeekend, 2 AMTime Multiplier: 0.7xDetectionPeriod: 5 min, Power: 0.15Confidence: 28.6x thresholdCombined Threshold Calculation:
Threshold = (Base * Process * Domain) * Time MultiplierThreshold = (0.25 * 0.20 * 0.15) * 0.7 = 0.00525Since the detected power (0.15) is 28.6 times the calculated contextual threshold, this is an undeniable high-fidelity alert.
Implementation Guide (The “Set It and Forget It” Approach)
The methodology is designed for automated, adaptive learning. We use a 7-day learning window to baseline normal activity, removing the constant manual tuning effort.
Python
class AdaptiveMultiDimensionalMicroDoppler:
def __init__(self, learning_window_days=7):
# … initialization …
def learn_periodic_profiles(self, historical_events):
“””Learn normal periodic patterns for each unique context (system, user, process, domain)”””
# 1. Group events by all dimensions (context)
# 2. Extract time series for each context
# 3. Apply FFT to identify dominant normal periodic patterns (e.g., 60 min)
# 4. Calculate variance and learn an optimal power threshold for each context profile
# Store: self.profiles[key] = { ‘normal_periods’: […], ‘power_threshold’: 0.25 }
pass
def detect_periodic_pattern(self, current_events):
“””Detect periodic patterns with context awareness against the learned profile”””
# 1. Look up the learned profile (with a fallback hierarchy if no profile exists)
# 2. Apply FFT to the current event stream
# 3. Check dominant power peaks against the context-aware threshold
# 4. Alert if power > (Threshold AND period NOT in normal_periods)
pass
# Usage: “Set it and forget it”
detector = AdaptiveMultiDimensionalMicroDoppler(learning_window_days=7)
detector.learn_periodic_profiles(historical_sysmon_events)
# Runtime: Just detect and notify
for event_batch in real_time_event_batches:
alerts = detector.detect_periodic_pattern(event_batch)
for alert in alerts:
if alert[‘confidence’] > 2.0:
# High-fidelity alert!
notify(f”Periodic pattern detected: {alert[‘period’]:.1f} min interval at {alert[‘confidence’]:.1f}x threshold.”)
Efficacy: Micro-Doppler vs. Machine Learning vs. Z-Scores
While complex ML algorithms (LSTMs, Transformers) can handle arbitrary sequences, their computational overhead and lack of interpretability make them poor fits for high-volume detection systems.
The Micro-Doppler approach occupies the Precision Zone, offering mathematically rigorous detection without the complexity of deep learning models or the high false positive rates of simple statistical thresholds.
AspectMulti-Dimensional Micro-DopplerStatistical (Z-Score/STDDEV)ML Algorithms (LSTM, Transformer)InterpretabilityHigh (Clear frequency/period)High (Simple deviation from mean)Low (Black box)Detection TargetExcellent (Designed for periodicity)Poor (Only measures count anomaly)Good (General purpose)Adaptation SpeedFast (Learns baseline in minutes/hours)Fast (Instantaneous calculation)Slow (Requires full model retraining)Computational CostLow (FFT is highly optimized)Lowest (Basic arithmetic)High (Neural network inference)False Positive RateLow (Context-aware, layered thresholds)Highest (Triggered by any burst/spike)VariableThe Z-score method is effective for spotting sudden, massive spikes in activity (i.e., DDoS or rapid data exfiltration). However, because C2 beaconing is intentionally low-volume and rhythmic, it often sits within a single standard deviation of the mean count. The Z-score is blind to the temporal ordering and uniformity of events, making it functionally useless for this specific, sophisticated threat.
Conclusion
The future of detection engineering requires mathematical rigor to escape the Chaos Zone. By applying the Multi-Dimensional Micro-Doppler Effect, we transform detection from a high-volume guessing game into a precise, physics-based measurement. This is the blueprint for enforcing Signal Clarity and making the most subtle, rhythmic threats mathematically undeniable.