
The Problem: Why Call Stack Analysis Matters
In the world of endpoint detection, we’re constantly chasing the next big thing. But sometimes, the most powerful detection capabilities are hiding in plain sight. Take Sysmon Event ID 10 (Process Access), it’s not just about which process accessed what. The real gold is in the CallTrace field.
When a process accesses another process’s memory, Windows records the complete call stack, every DLL and memory offset that led to that access. This isn’t just telemetry noise; it’s a fingerprint of execution behavior that can reveal sophisticated attack techniques that traditional signature-based detection misses.
The Detection Gap
Most security teams focus on:
- Process names and command lines
- Network connections
- File system changes
But they miss the subtle patterns in how processes interact with each other. A legitimate process accessing lsass.exe might look normal, but the DLL sequence in its call stack tells a different story.
The Solution: Statistical Anomaly Detection on Call Stacks
Why Z-Score Analysis Works
Traditional detection relies on known bad patterns. But what about the unknown? Z-score analysis on call stack sequences identifies deviations from normal behavior without requiring prior knowledge of the attack.
Here’s the core concept: Every process pair has a “normal” DLL loading pattern. When malware injects code or performs process hollowing, it creates call stacks that deviate from these baselines.
Note: The complete detection query with full 25-DLL sequence analysis is available in the StealPack beta release of the Bloo platform.
Operational Trade-offs: Fidelity vs. Noise
The Challenge
This approach generates alerts based on statistical deviations, not known bad patterns. That means:
Pros:
- Catches unknown attack techniques
- Adapts to your environment’s baseline
- No signature updates required
Cons:
- Requires sufficient historical data for meaningful baselines (Ideally, 90 days duration as a start is good, considering the environment is not already compromised 🙁 )
- May generate false positives during legitimate software updates
- Needs tuning per environment
The Reality Check
In production, we’ve found that z-scores > 1.5 typically indicate real threats, while 1.0 to 1.5 require investigation. Below 1? Usually noise.
Real-World Detection Scenarios
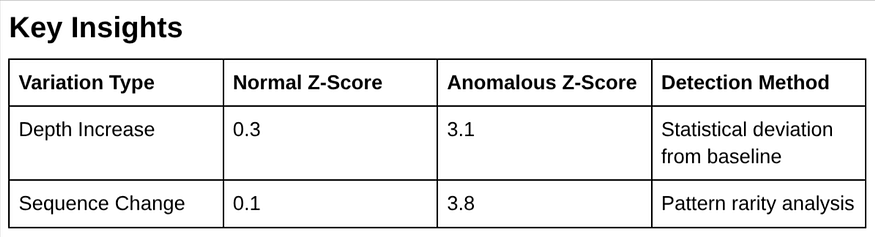
Scenario 1: Same Process Pair, Call Stack Depth Variation
System: WIN-SERVER-01SourceImage: explorer.exeTargetImage: chrome.exe
Normal Baseline (Z-Score: 0.3)Call Stack Depth: 6 DLLs
Sequence: ntdll.dll|KERNELBASE.dll|user32.dll|explorer.exe
Frequency: 1,156 occurrences in 30 days
Classification: Normal Sequence
Anomalous Depth Increase (Z-Score: 3.1)Call Stack Depth: 12 DLLs (doubled depth)
Sequence: ntdll.dll|KERNELBASE.dll|user32.dll|ole32.dll|advapi32.dll|explorer.exe
Frequency: 3 occurrences in 30 days
Classification: Unusual Sequence Pattern
Scenario 2: Same Process Pair, Same Depth, Different Sequence
System: WORKSTATION-03SourceImage: wininit.exeTargetImage: lsass.exe
Normal Baseline (Z-Score: 0.1)Call Stack Depth: 4 DLLs
Sequence: ntdll.dll|KERNELBASE.dll|wininit.exe
Frequency: 2,847 occurrences in 30 days
Classification: Normal Sequence
Anomalous Sequence (Z-Score: 3.8)Call Stack Depth: 4 DLLs (same depth, different sequence)
Sequence: ntdll.dll|advapi32.dll|wininit.exe
Frequency: 2 occurrences in 30 days
Classification: Unusual Sequence Pattern
Detection Logic
- Scenario 1: Depth variation indicates process injection or code injection
- Scenario 2: Sequence variation indicates DLL side-loading or malicious DLL injection
Operational Considerations
- Depth variations often indicate code injection or process manipulation
- Sequence variations suggest DLL side-loading or malicious library injection
- Z-score thresholds should be tuned based on environment baseline
- Frequency analysis helps distinguish between legitimate updates and malicious activity
MITRE ATT&CK Mapping: Why T1055 Fits
T1055, Process Injection applies because:
- Technique Context: Attackers inject code into legitimate processes to evade detection
- Call Stack Evidence: Injected code creates unusual DLL loading sequences
- Detection Relevance: Our z-score analysis catches these deviations
This isn’t just academic mapping, it’s operational reality. When we see unusual call stacks accessing lsass.exe, we’re often looking at credential dumping attempts.
Platform-Level Implications
For Detection Engineers:
- Implement baseline learning periods (30+ days recommended)
- Tune z-score thresholds based on your environment
- Create separate alerts for different process pairs
For Security Architects:
- Consider call stack analysis as part of your EDR strategy
- Balance detection depth with performance impact
- Plan for the operational overhead of statistical alerts
For MDR Teams:
- This detection requires context and investigation
- Not every high z-score is malicious
- Build playbooks for call stack analysis
What’s Next: Beyond the Query
This detection is just the beginning. Consider extending it to:
- Memory Region Analysis: Different attack techniques use different memory regions
- DLL Transition Patterns: Markov chain analysis of DLL loading sequences
- Cross-Process Correlation: Linking unusual call stacks across multiple processes
The Bottom Line
Call stack analysis isn’t about finding the needle in the haystack, it’s about finding the haystack that shouldn’t be there. By applying statistical anomaly detection to Sysmon Event ID 10 call traces, we can catch sophisticated attack techniques that traditional detection misses.
The key is operational discipline: tune your thresholds, investigate your alerts, and build your baselines. Because in the end, the best detection is the one that catches real threats without drowning you in false positives.
This approach has been tested in production environments and has successfully identified process injection attempts, credential dumping, and other sophisticated attack techniques. The statistical approach provides a foundation for catching unknown threats while maintaining operational efficiency.